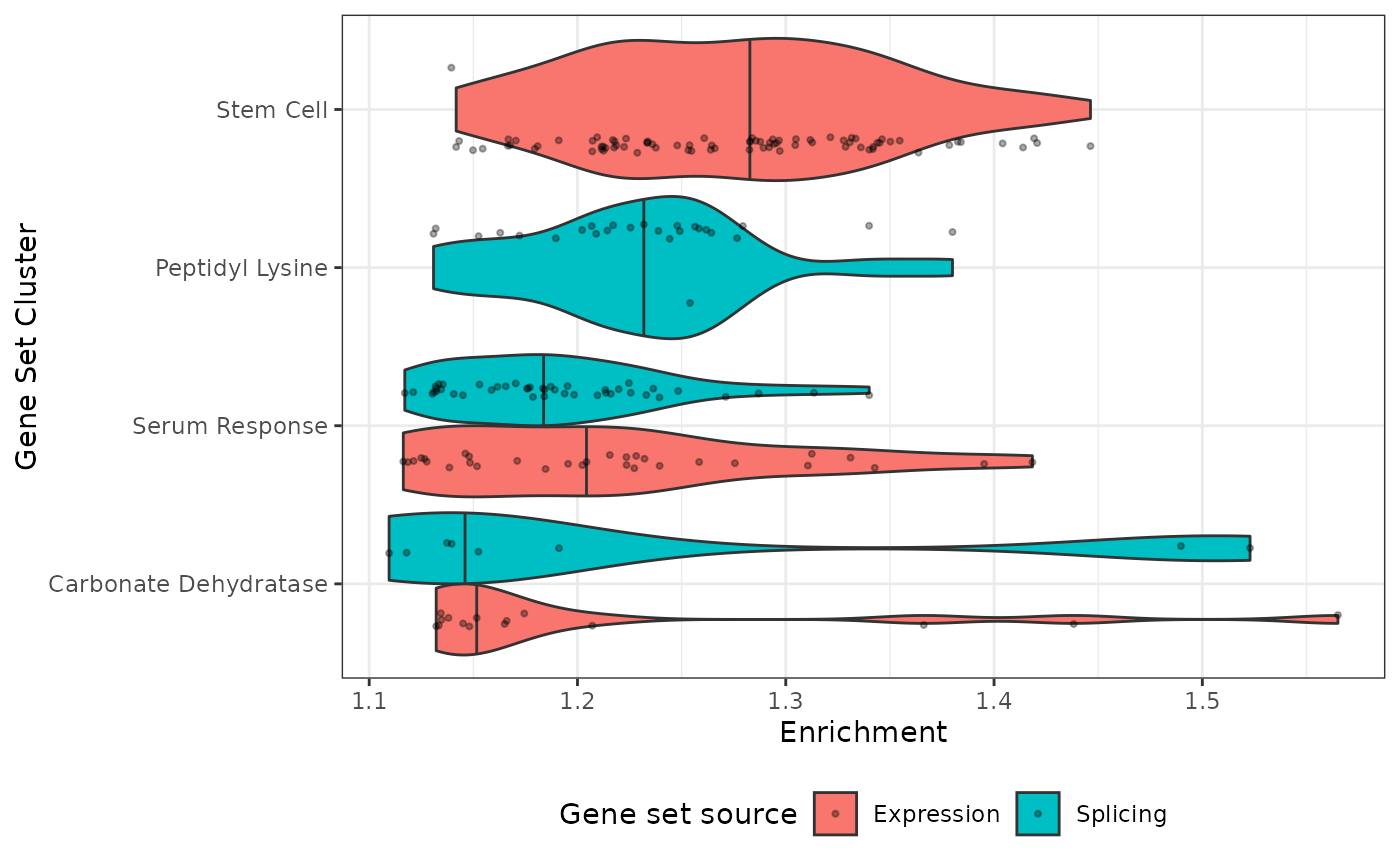
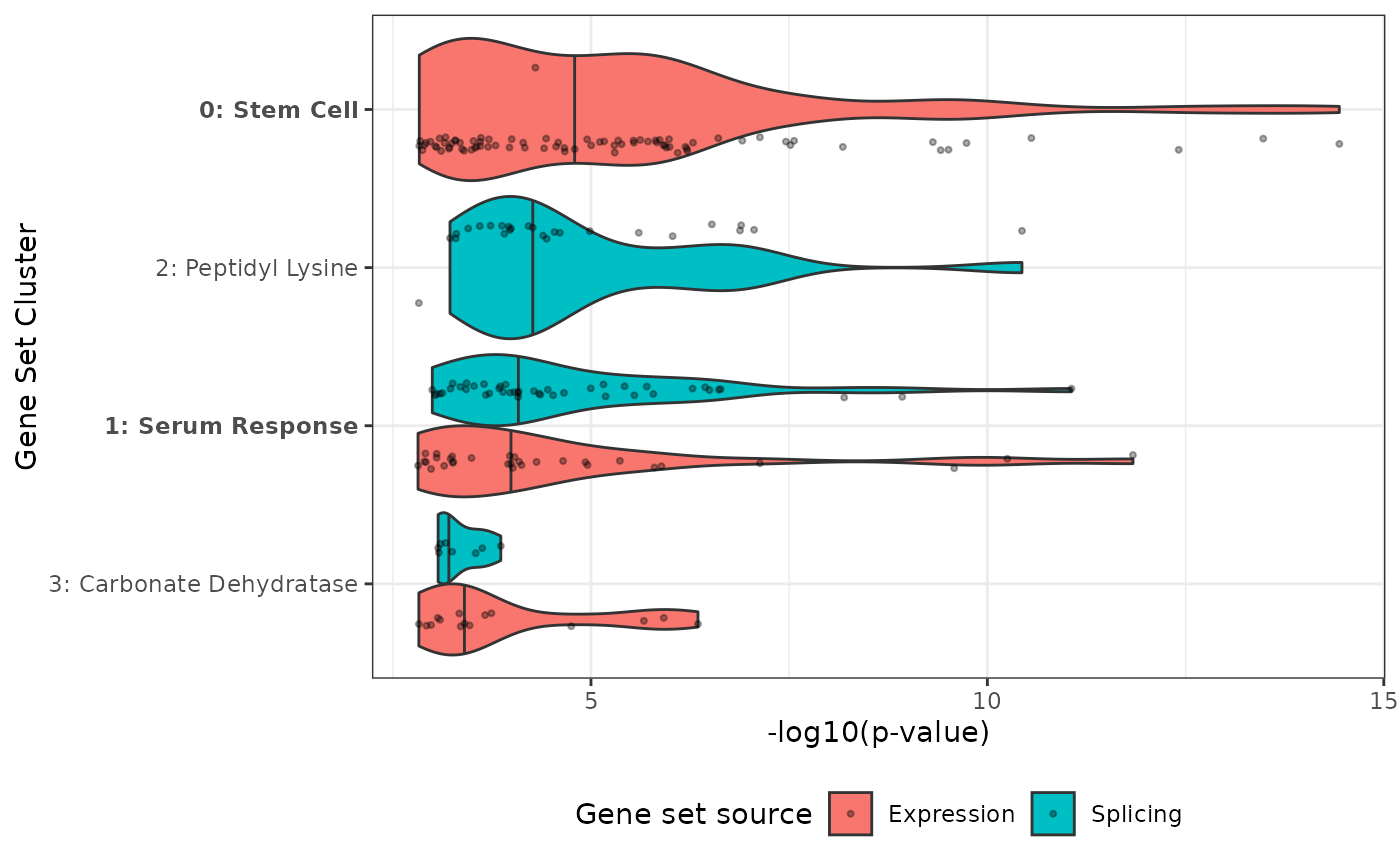
Creates a violin plot of the values of the gene sets in each cluster, by default their -log10 p-values (or enrichment scores when no p-values were supplied). Clusters are ordered by their median value.
Usage
plotViolin(
  geneSetsList,
  resolution = NULL,
  plotFrom = c("nlog10pval", "enrichment_score"),
  removeClusterId = FALSE,
  highlightClusterNo = NULL
)
Arguments
- geneSetsList
'gsList' object with clusters and labels.
- resolution
The cluster resolution to plot. Default
NULLuses the active resolution: the optimal resolution found byclusterGeneSets(), or the one last set withupdateResolution()orupdateClusterLabels().- plotFrom
Name of the column of the 'enrichmentScore' slot to visualize, e.g. 'nlog10pval' or 'enrichment_score'. Only numeric columns that are annotated (i.e. not all NA) can be plotted - which columns are available depends on what was supplied to 'geneSetsDF' in 'initializeList()'. Only one column is plotted; if several are supplied the first plottable one is used (the default therefore falls back to 'enrichment_score' when no p-values were supplied).
- removeClusterId
Logical, if TRUE the cluster number will be removed from each cluster label. Default: FALSE.
- highlightClusterNo
A vector with the cluster numbers of the clusters (at the resolution) to highlight (in bold) in the plot.
Examples
plotViolin(exampleGsList, highlightClusterNo = c(0, 1))
 plotViolin(exampleGsList, plotFrom = 'enrichment_score', removeClusterId = TRUE)