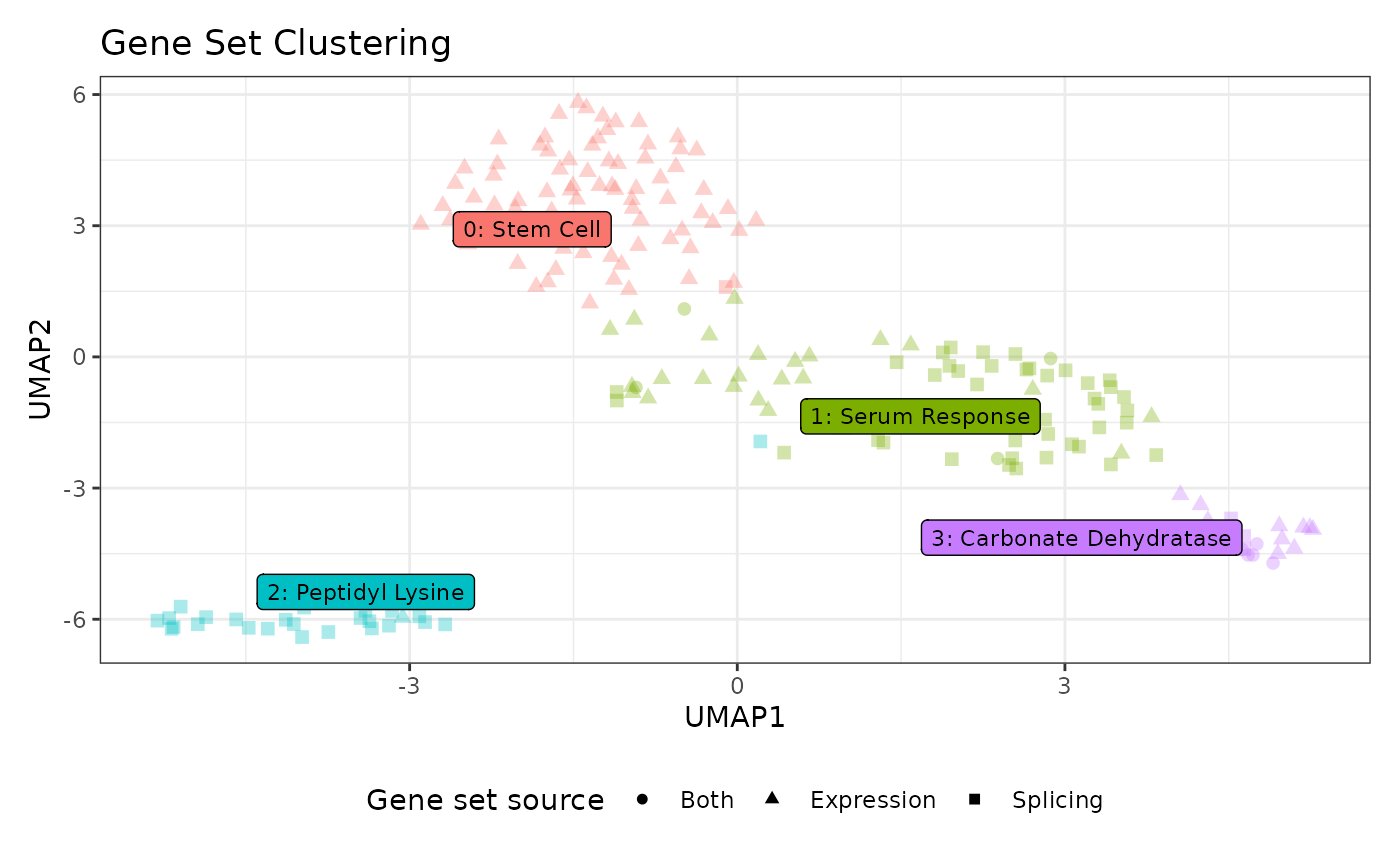
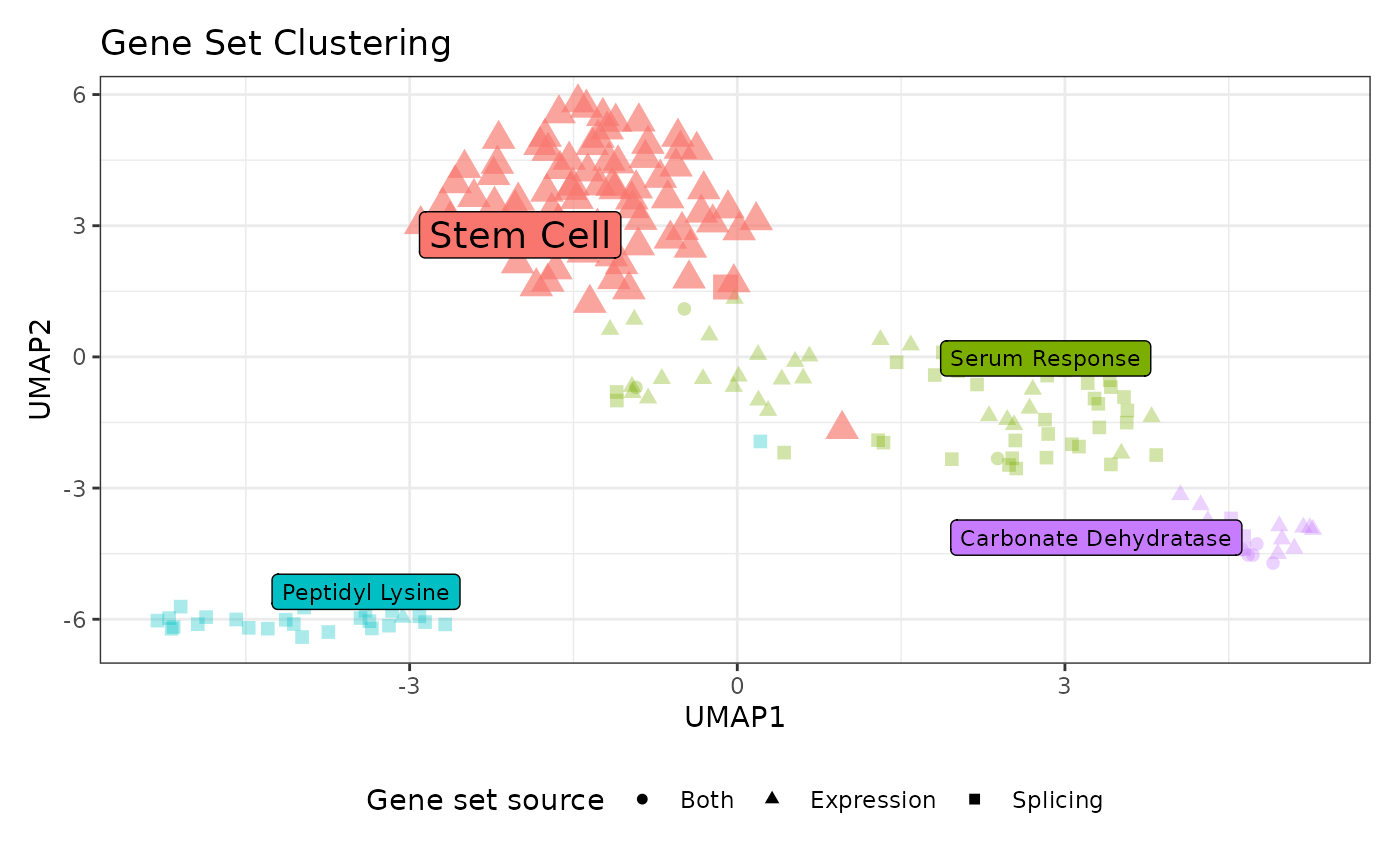
Graphs the output of the UMAP dimensionality reduction as a scatterplot using the 'DimPlot()' function from the Seurat package. Gene sets are colored and labeled by their cluster. When there is only one source in the data (default), each point will be shaped by the direction of the enrichment score of the gene set. When there are two sources in the data, each point will be shaped by the source indicating whether the gene set was found significant in either or both sources. With three or more sources, points are not shaped.
Usage
plotUMAP(
  geneSetsList,
  resolution = NULL,
  removeClusterId = FALSE,
  interactive = FALSE,
  highlightClusterNo = NULL,
  pointSize = 2,
  pointAlpha = 1/3,
  labelSize = 3,
  labelAlpha = 1,
  highlightPointAlpha = 2/3,
  highlightPointSize = 4,
  highlightLabelAlpha = 1,
  highlightLabelSize = 5
)
Arguments
- geneSetsList
'gsList' object with clusters and labels.
- resolution
The cluster resolution to plot. Default
NULLuses the active resolution: the optimal resolution found byclusterGeneSets(), or the one last set withupdateResolution()orupdateClusterLabels().- removeClusterId
Logical, if TRUE the cluster number will be removed from each cluster label. Default: FALSE.
- interactive
Logical, indicating whether to plot an interactive UMAP plot. Default: FALSE. If TRUE, an interactive plot is made with 'HoverLocator()' from the Seurat package; hovering over a point shows its gene set and cluster.
- highlightClusterNo
A vector with the cluster numbers of the clusters (at the resolution) to highlight in the plot.
- pointSize
Size of points. Default is 2.
- pointAlpha
Transparency of points. Default is 1/3.
- labelSize
Size of the cluster labels. Default is 3.
- labelAlpha
Transparency of the cluster labels. Default is 1.
- highlightPointAlpha
Transparency of the points of highlighted clusters. Default is 2/3.
- highlightPointSize
Size of the points of highlighted clusters. Default is 4.
- highlightLabelAlpha
Transparency of the labels of highlighted clusters. Default is 1.
- highlightLabelSize
Size of the labels of highlighted clusters. Default is 5.