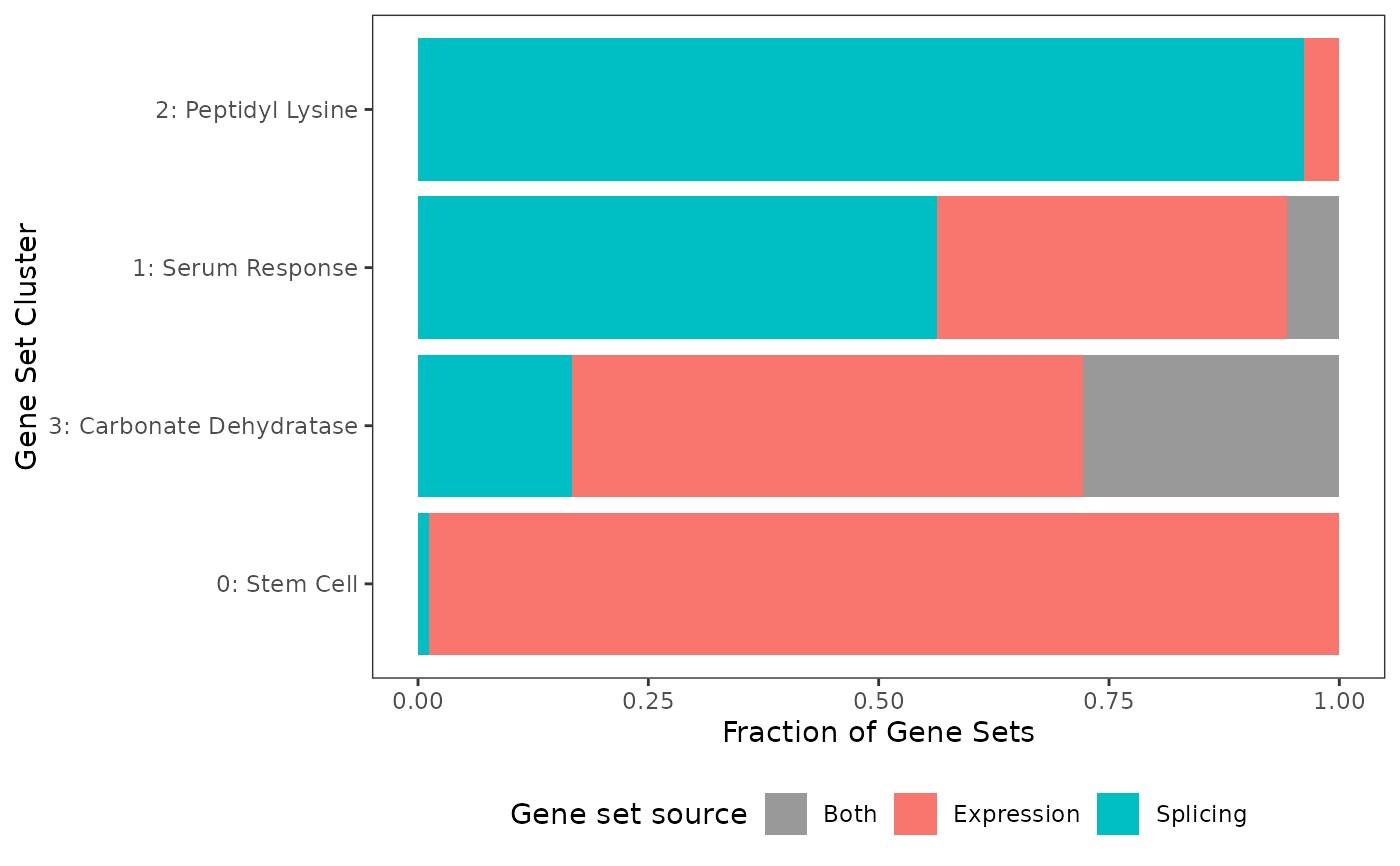
Plot proportions of gene sets in each cluster for each source
Source:R/plotProportions.R
plotProportions.RdGraphs a bar plot showing the proportion of gene sets within each cluster that come from each source in the analyzed data. A gene set found in several sources is counted once, as 'Both' (two sources) or 'Multiple' (three or more). Needs at least two sources.
Usage
plotProportions(
  geneSetsList,
  resolution = NULL,
  removeClusterId = FALSE,
  highlightClusterNo = NULL
)
Arguments
- geneSetsList
'gsList' object with clusters and labels.
- resolution
The cluster resolution to plot. Default
NULLuses the active resolution: the optimal resolution found byclusterGeneSets(), or the one last set withupdateResolution()orupdateClusterLabels().- removeClusterId
Logical, if TRUE the cluster number will be removed from each cluster label. Default: FALSE.
- highlightClusterNo
A vector with the cluster numbers of the clusters (at the resolution) to highlight (in bold) in the plot.