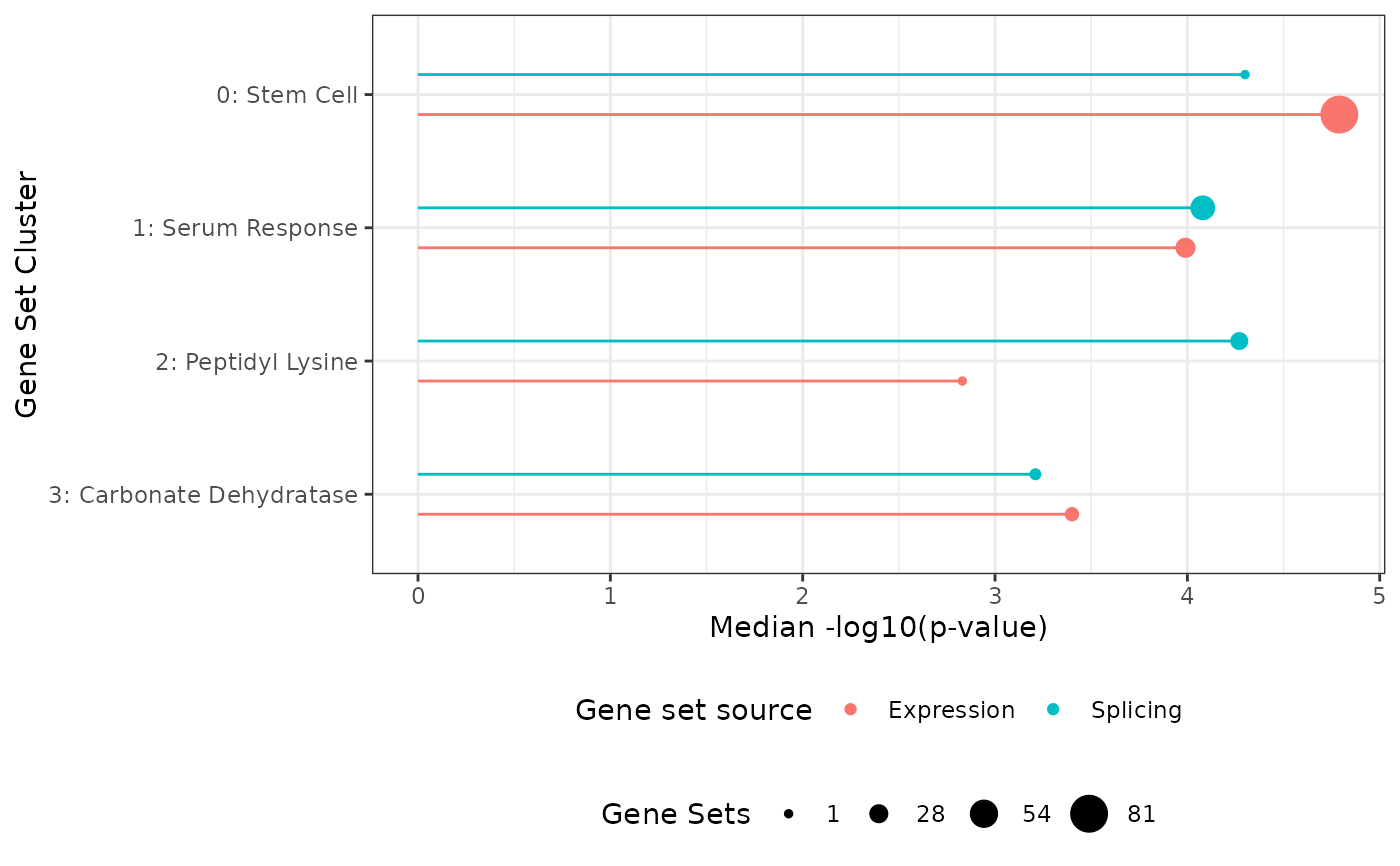
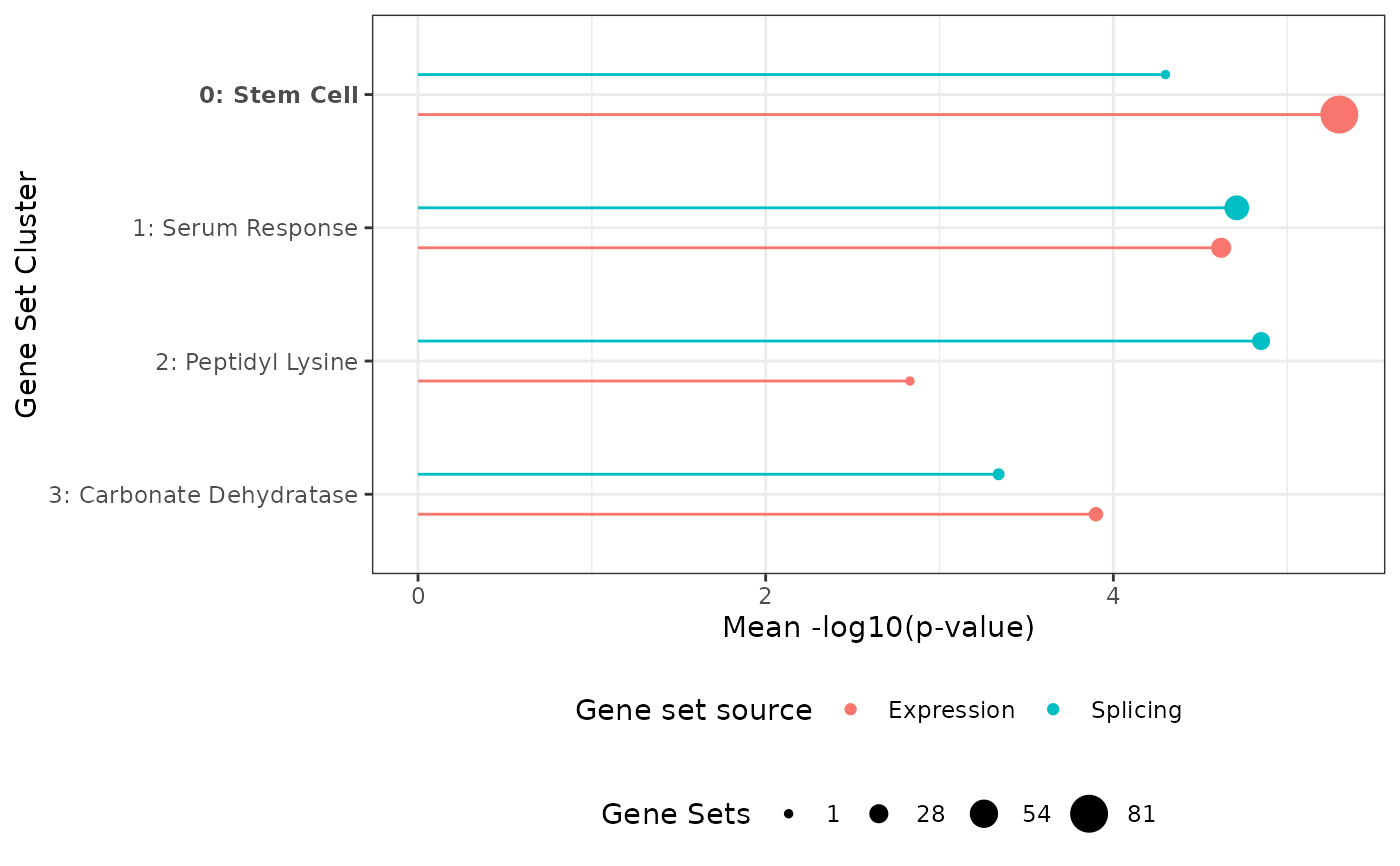
Creates a lollipop plot showing the summarized enrichment and size of each gene-set cluster.
Arguments
- geneSetsList
'gsList' object with clusters and labels.
- resolution
The cluster resolution to plot. Default
NULLuses the active resolution: the optimal resolution found byclusterGeneSets(), or the one last set withupdateResolution()orupdateClusterLabels().- plotFrom
Name of the column of the 'enrichmentScore' slot to visualize, e.g. 'nlog10pval' or 'enrichment_score'. Only numeric columns that are annotated (i.e. not all NA) can be plotted - which columns are available depends on what was supplied to 'geneSetsDF' in 'initializeList()'. Only one column is plotted; if several are supplied the first plottable one is used (the default therefore falls back to 'enrichment_score' when no p-values were supplied).
- summaryStat
How the values of the gene sets within a cluster are summarized into the value shown for each cluster. One of 'median' (default), 'max' or 'mean'. Note that 'max' is the largest signed value, so for signed scores (e.g. NES) a strongly negative cluster will be summarized by its least negative gene set.
- removeClusterId
Logical, if TRUE the cluster number will be removed from each cluster label. Default: FALSE.
- highlightClusterNo
A vector with the cluster numbers of the clusters (at the resolution) to highlight (in bold) in the plot.