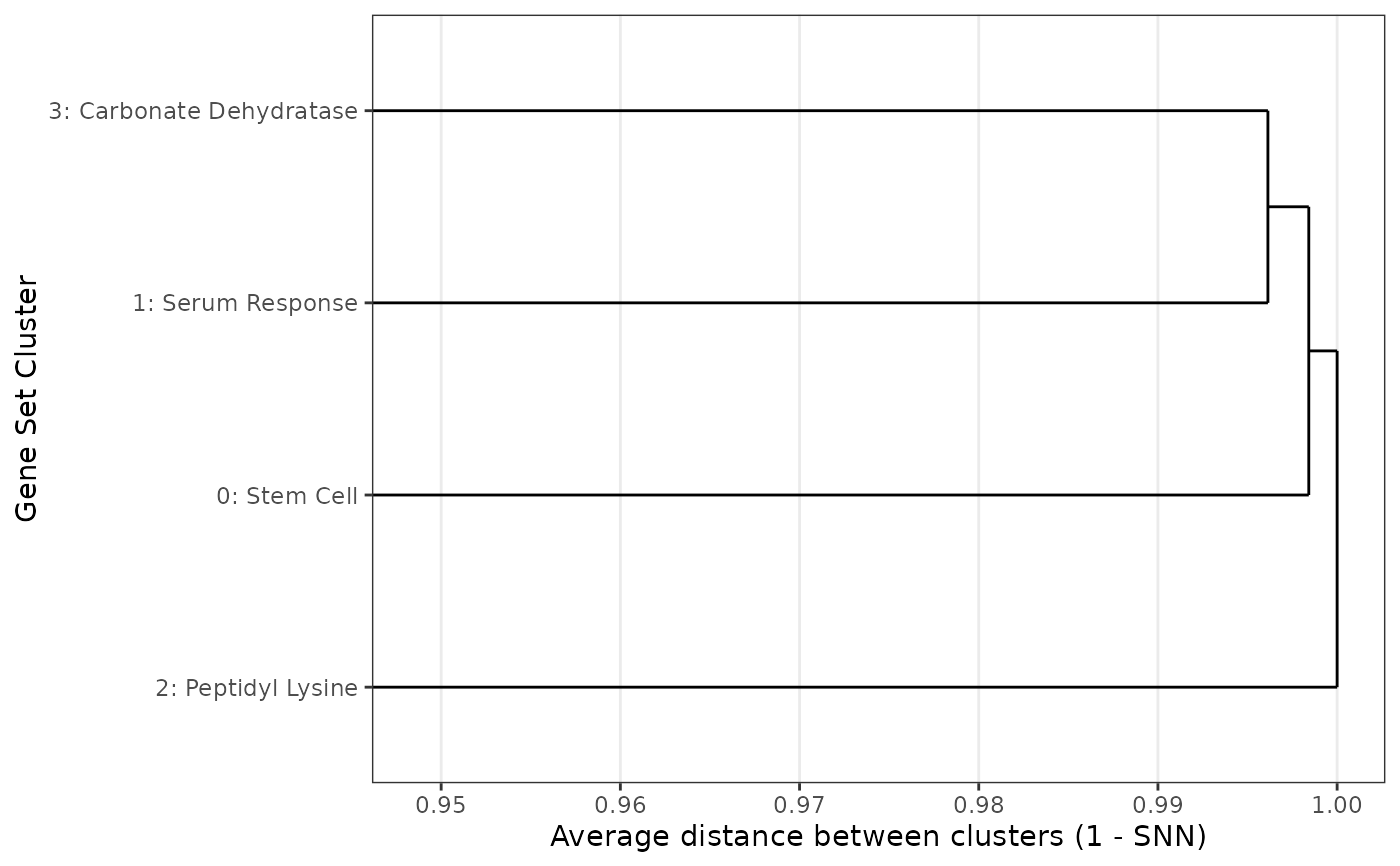
A plot showing the hierarchical clustering of the cluster averages (dendrogram). A tool made for showing how clusters (not individual gene-sets) relate to each other. The distance between two clusters is the average SNN distance (1 - SNN similarity) between their gene sets, and clusters are joined by complete linkage.
Usage
plotDendrogram(
  geneSetsList,
  resolution = NULL,
  removeClusterId = FALSE,
  highlightClusterNo = NULL
)
Arguments
- geneSetsList
'gsList' object with clusters and labels.
- resolution
The cluster resolution to plot. Default
NULLuses the active resolution: the optimal resolution found byclusterGeneSets(), or the one last set withupdateResolution()orupdateClusterLabels().- removeClusterId
Logical, if TRUE the cluster number will be removed from each cluster label. Default: FALSE.
- highlightClusterNo
A vector with the cluster numbers of the clusters (at the resolution) to highlight (in bold) in the plot.
Examples
plotDendrogram(exampleGsList)
 hc <- attr(plotDendrogram(exampleGsList), "hclust")