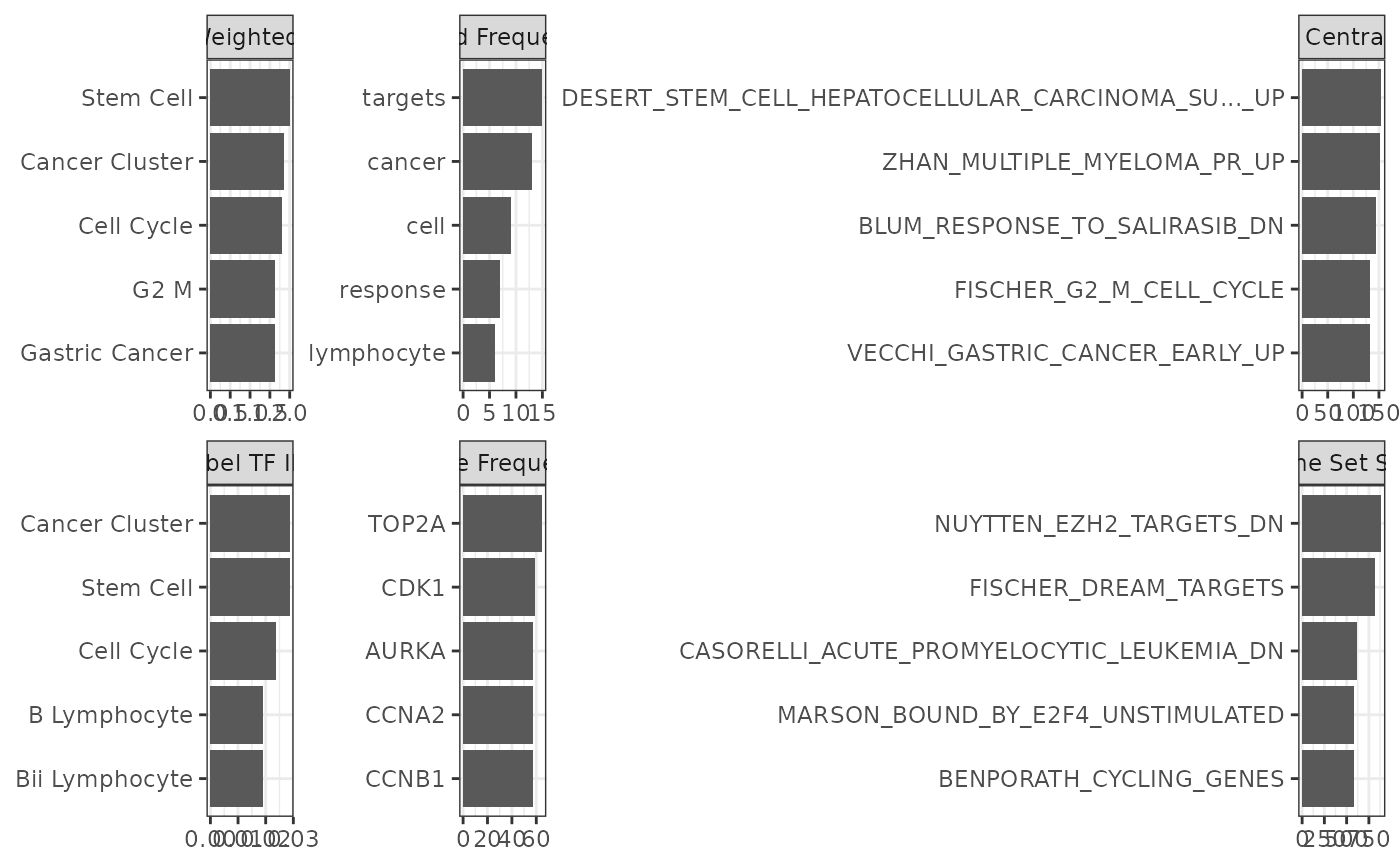
Shows why a cluster got its label: the top label candidates
with their combined and TF-IDF scores, the most central gene sets, the
most frequent words and genes, and the largest gene sets of the cluster.
Labels are the original ones from labelClusters(), also after a rename
with updateClusterLabels().
Usage
plotClusterLabels(
  geneSetsList,
  clusterNumber,
  resolution = NULL,
  nLabels = 5,
  maxChar = 50
)
Arguments
- geneSetsList
'gsList' object that has been clustered and labeled.
- clusterNumber
Which cluster to plot, given by its cluster number.
- resolution
The cluster resolution to plot. Default
NULLuses the active resolution: the optimal resolution found byclusterGeneSets(), or the one last set withupdateResolution()orupdateClusterLabels().- nLabels
The number of labels to plot. Default to 5
- maxChar
The max number of characters of labels shown in plot. Longer labels will be truncated using "...". Defaults to 50