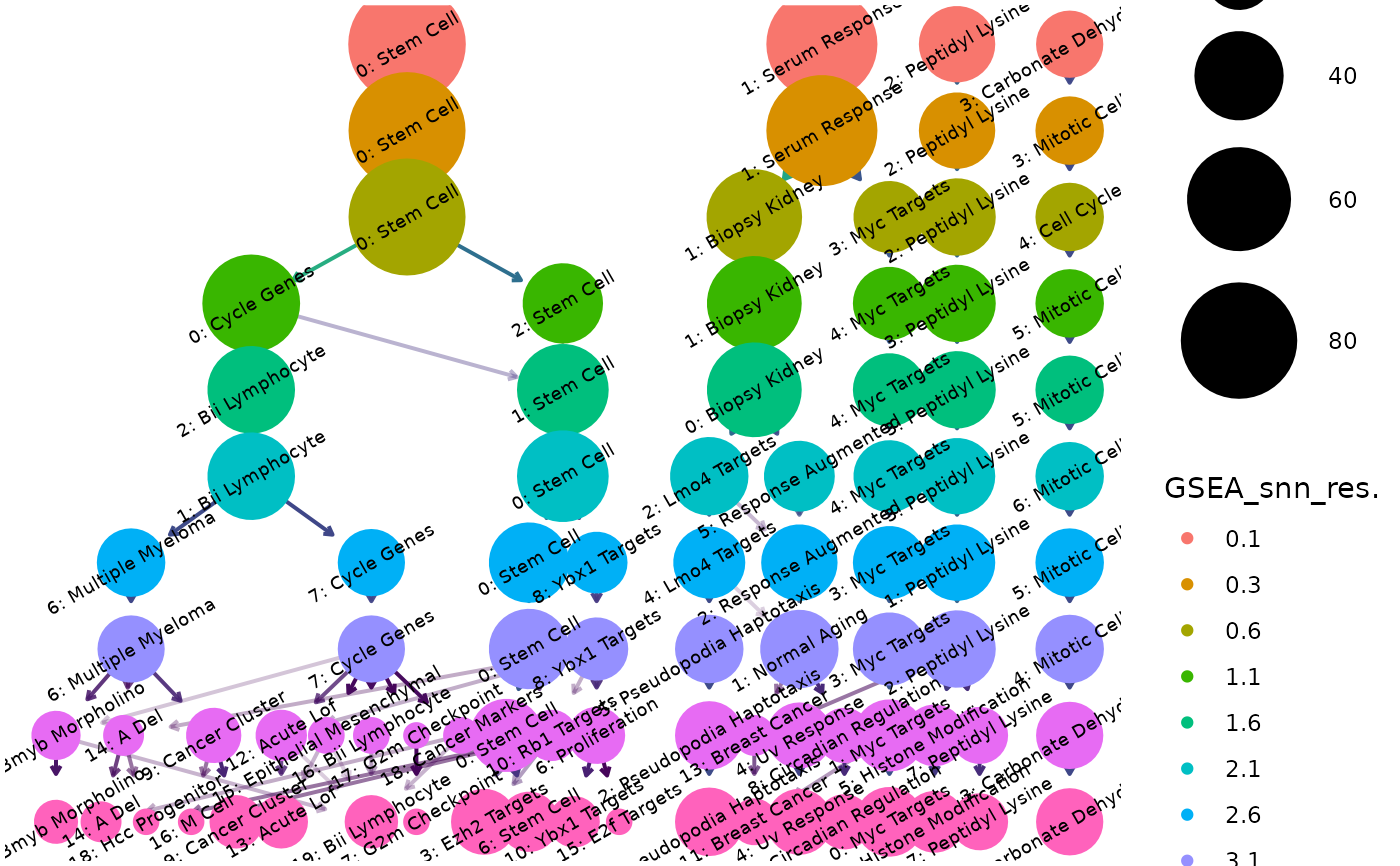
Graphs a clustering tree showing how the clusters of consecutive resolutions relate to each other: each node is a cluster (labeled with its top label), and edges show how many gene sets move from a cluster at one resolution to a cluster at the next.
Usage
plotClustree(
  geneSetsList,
  node_alpha = 1,
  node_text_size = 2.5,
  node_size_range = c(4, 20),
  edge_width = 0.7,
  node_text_angle = 30,
  resolutionsToPlot = NULL
)
Arguments
- geneSetsList
'gsList' object with clusters and labels.
- node_alpha
Numeric value indicating the alpha of nodes
- node_text_size
Numeric value indicating node text size
- node_size_range
Numeric vector with two values indicating the minimum and maximum point size of nodes, respectively
- edge_width
Numeric value indicating the width of plotted edges
- node_text_angle
Numeric value indicating the rotation of node labels
- resolutionsToPlot
Resolutions to include in plot. Use NULL to plot all. Default is NULL